Transforming Google Ads Campaigns using BigQuery's ML (Tech)


This is a continuation of the article that I wrote before and is for practitioners who want to get into more details, please continue to read…

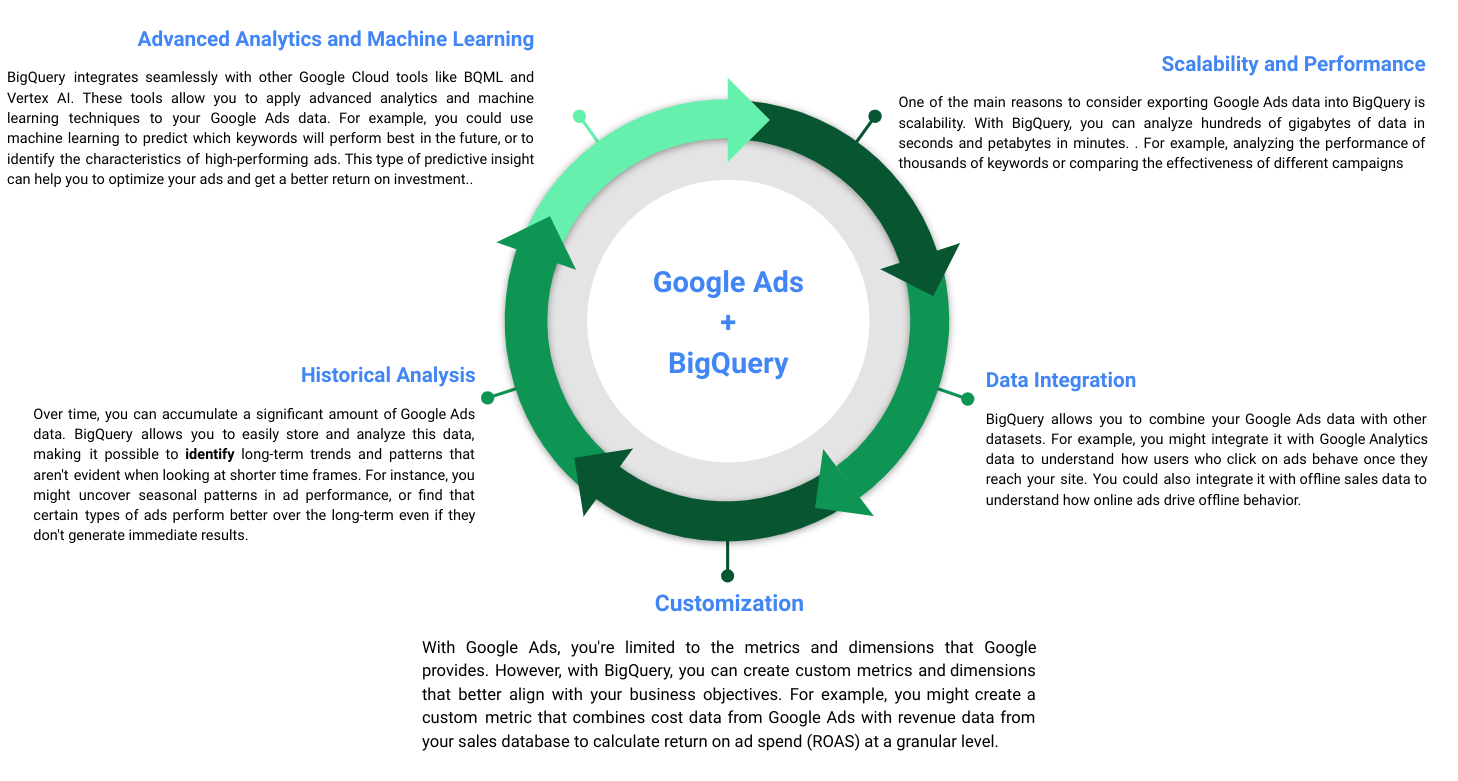
Here is a TL:DR version of the pivotal reasons why Google Ads data integration with BigQuery can revolutionize your marketing strategy are as follows
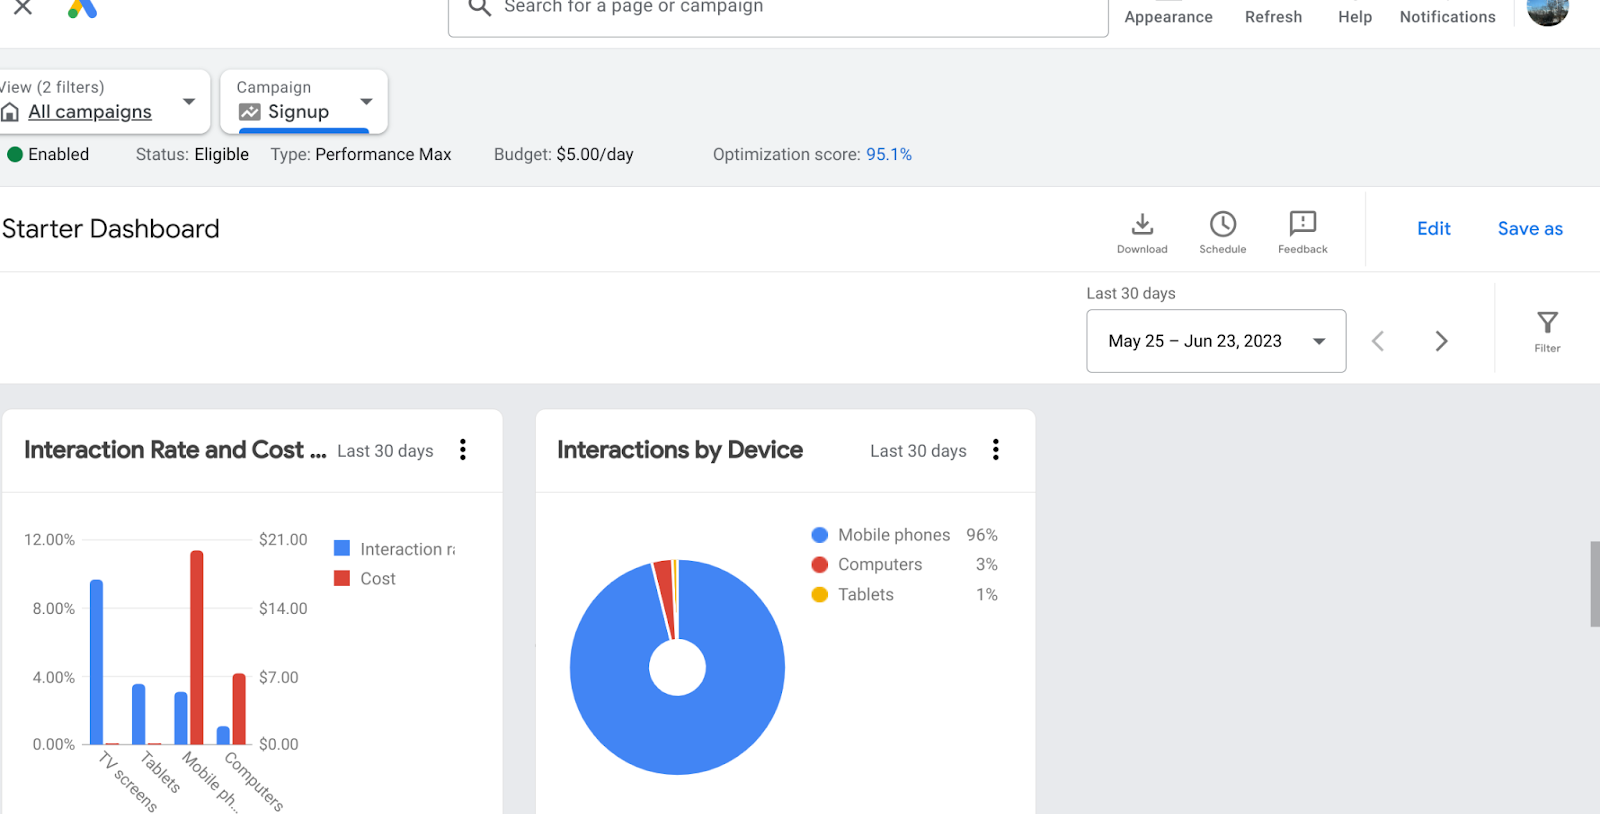
For going into the details, we will use the following. I have my Google Ads account and I am running a small campaign to help create more visibility to my website advancedmartech. Here is a screenshot of my Google Ads account:
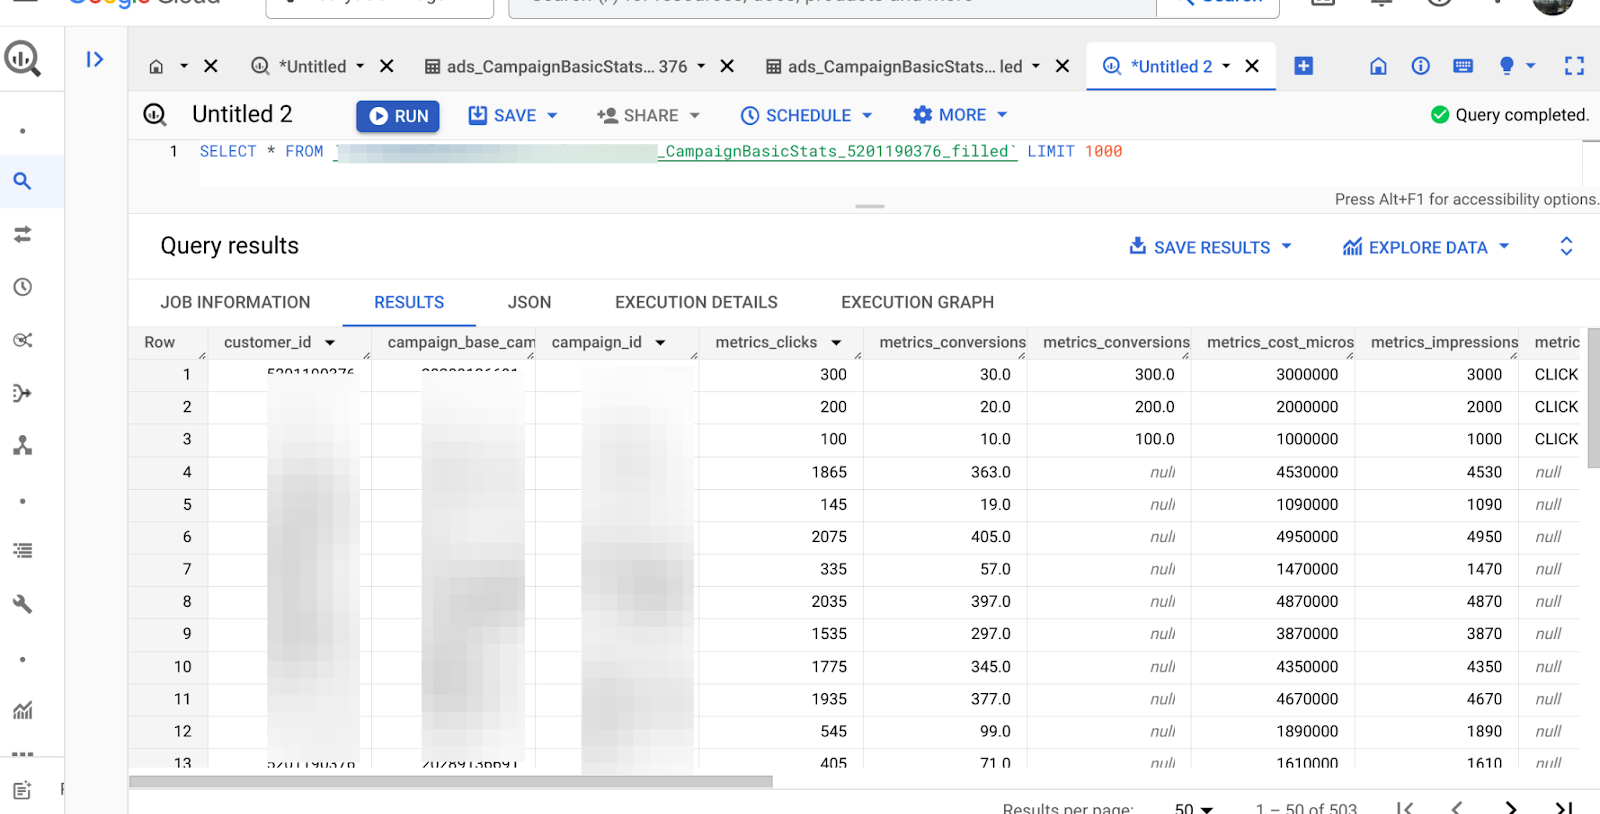
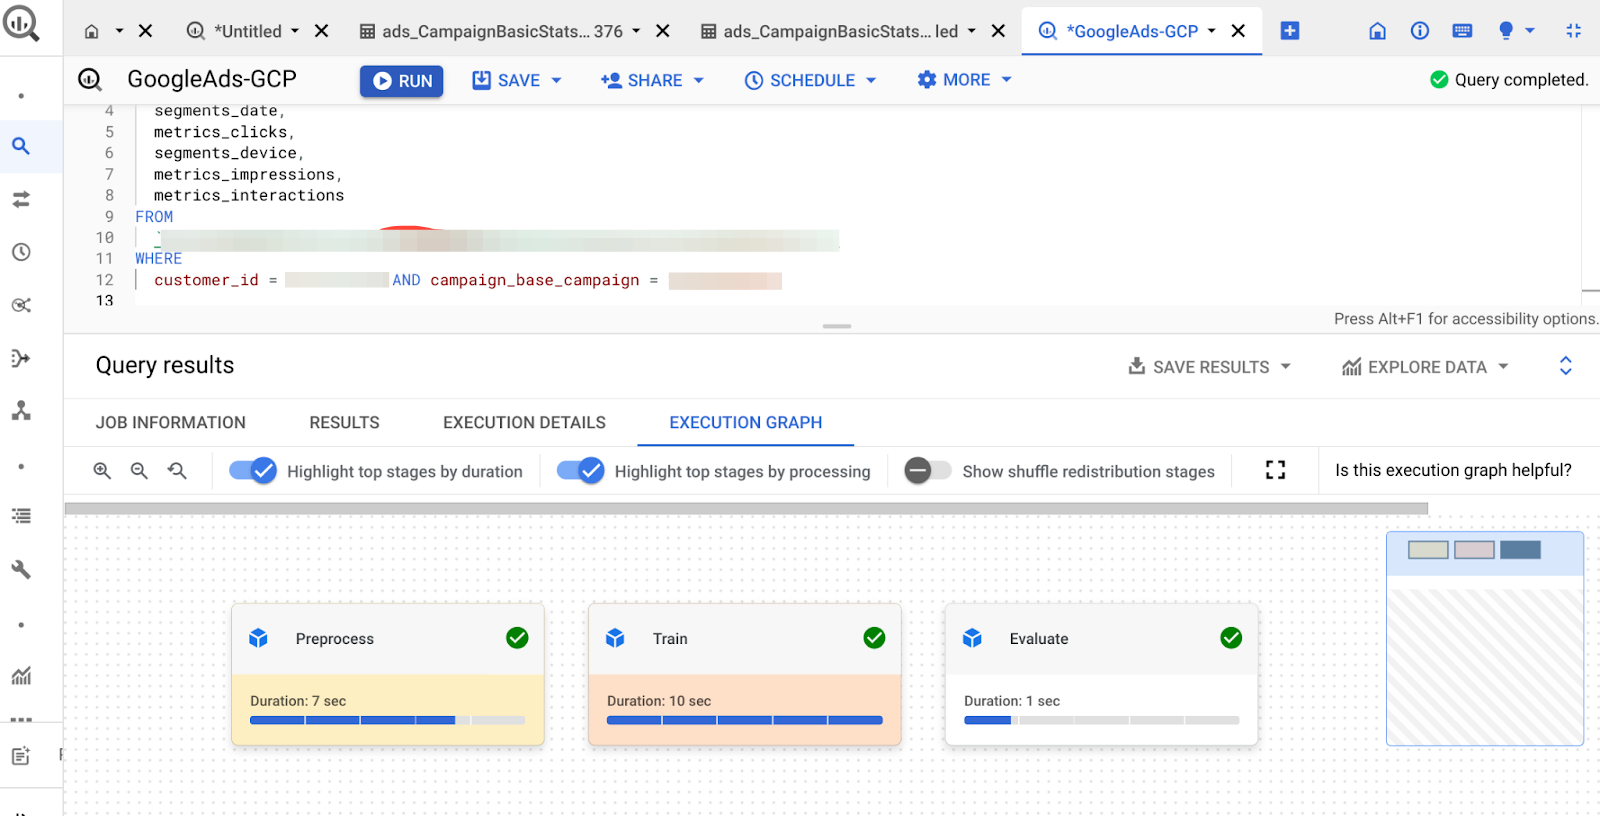
So I am going to connect my Google Ads account to my Google BigQuery and extract the Campaign data into BQ. Once I have done that, here is how my table would look like
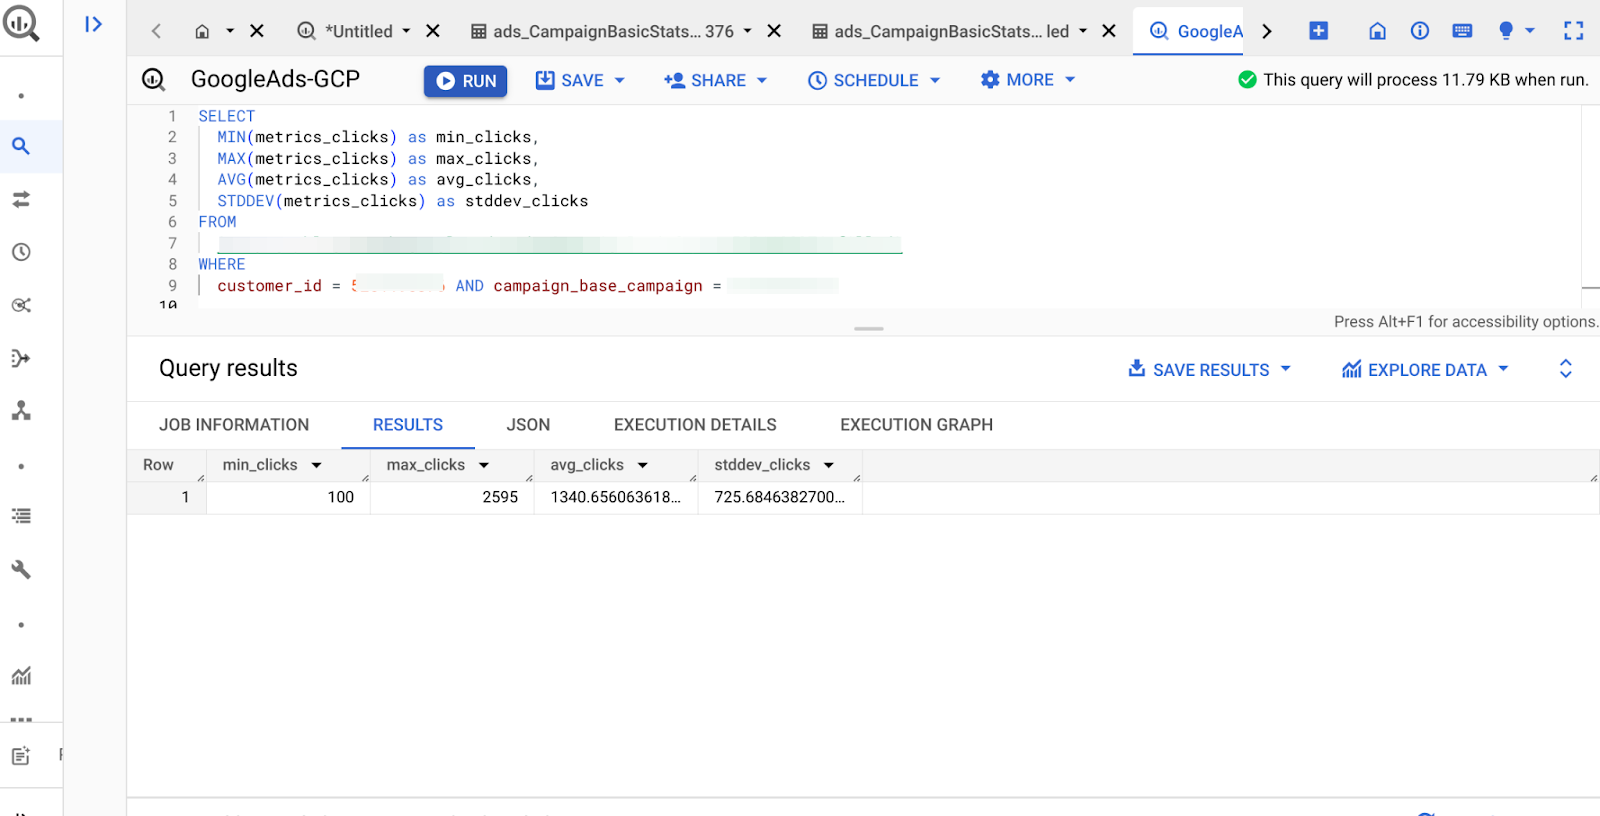
Let's do some quick Exploratory Data Analysis.
Summary statistics for metrics_clicks
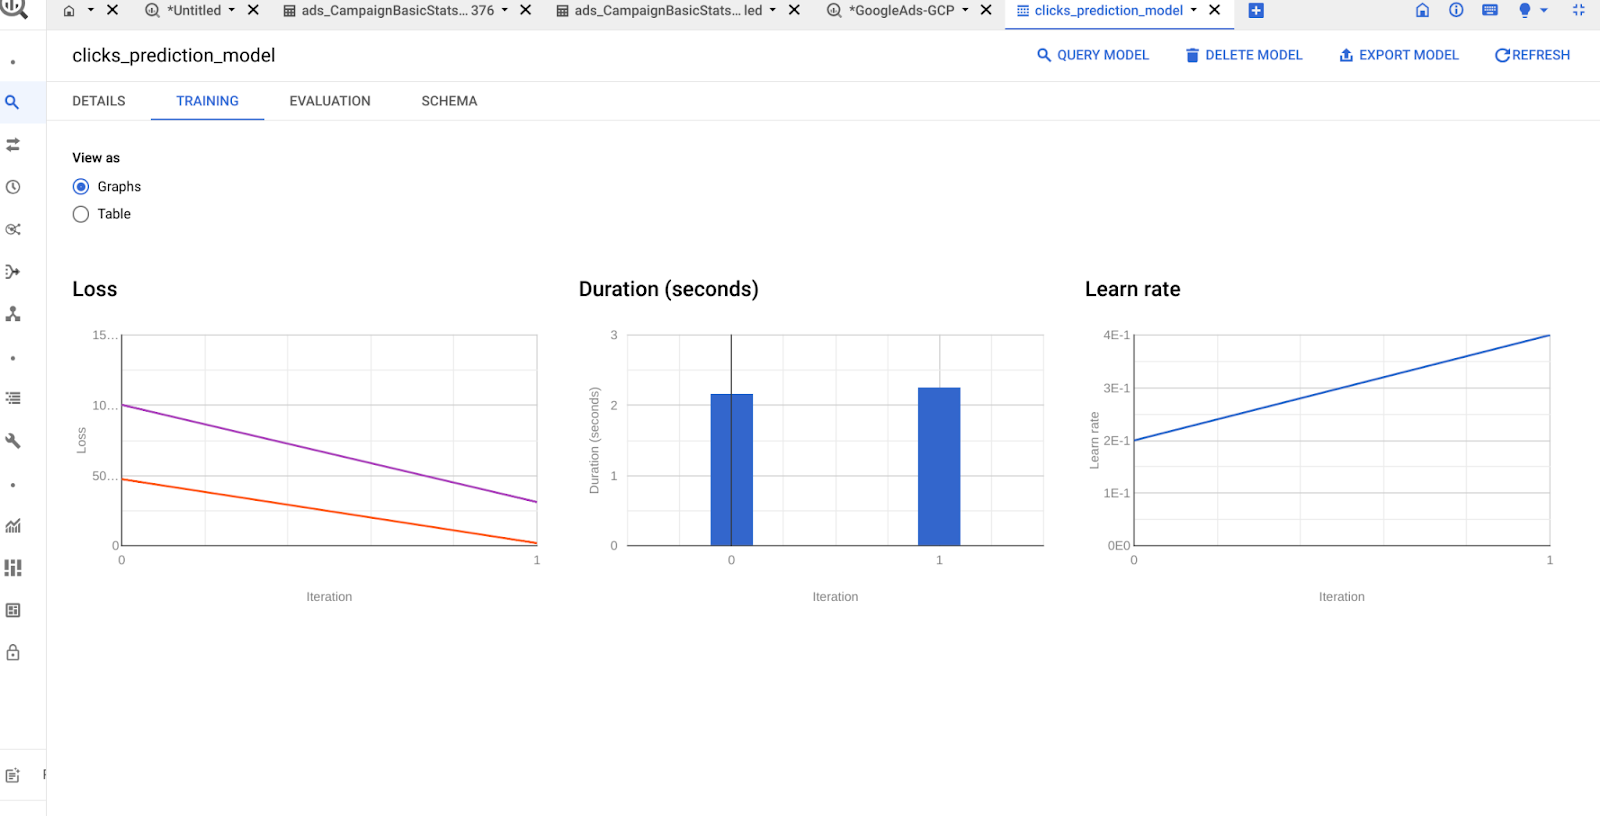
We will now create a model to predict the metrics_clicks target variable. We'll use the CREATE MODEL statement, which will create a new BQML model in your dataset.
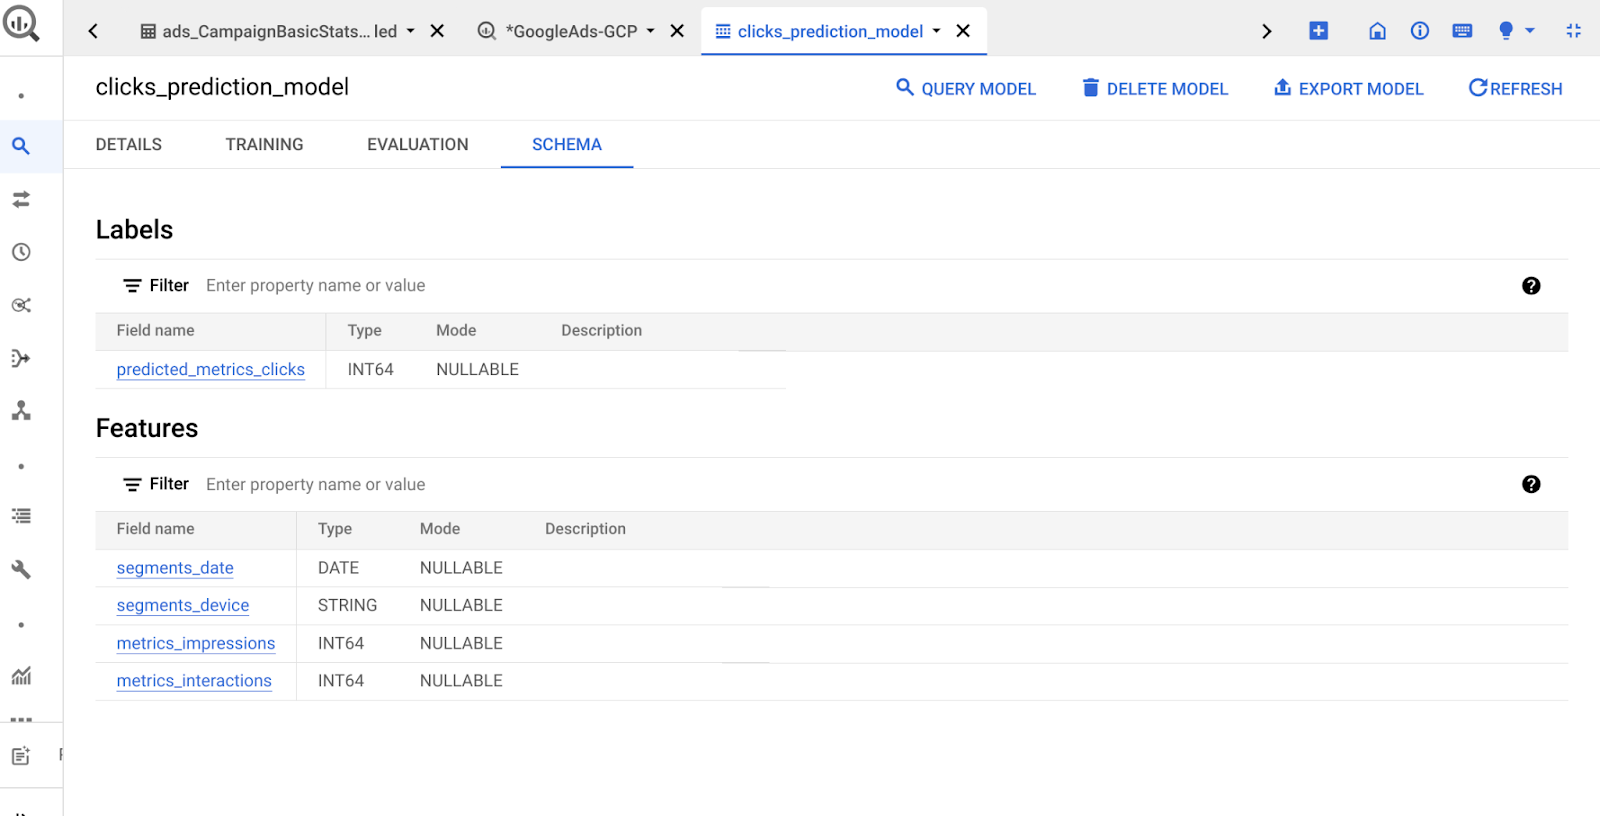
This SQL command will create a linear regression model named clicks_prediction_model using the segments_date, segments_device, metrics_impressions, and metrics_interactions columns as features, and the metrics_clicks column as the target. The WHERE clause ensures that only data pertaining to your customer ID and campaign ID is used for model training.
And here is the model:
To evaluate the performance of a BigQuery ML model, you can use the ML.EVALUATE function. This function evaluates the predicted outcome of a model versus the actual outcome. For regression models, it returns metrics such as mean absolute error, mean squared error, mean squared logarithmic error, median absolute error, R2 score, and explained variance.
Okayish model and there are ways to improve it, but for the purposes of this blog, let's proceed.
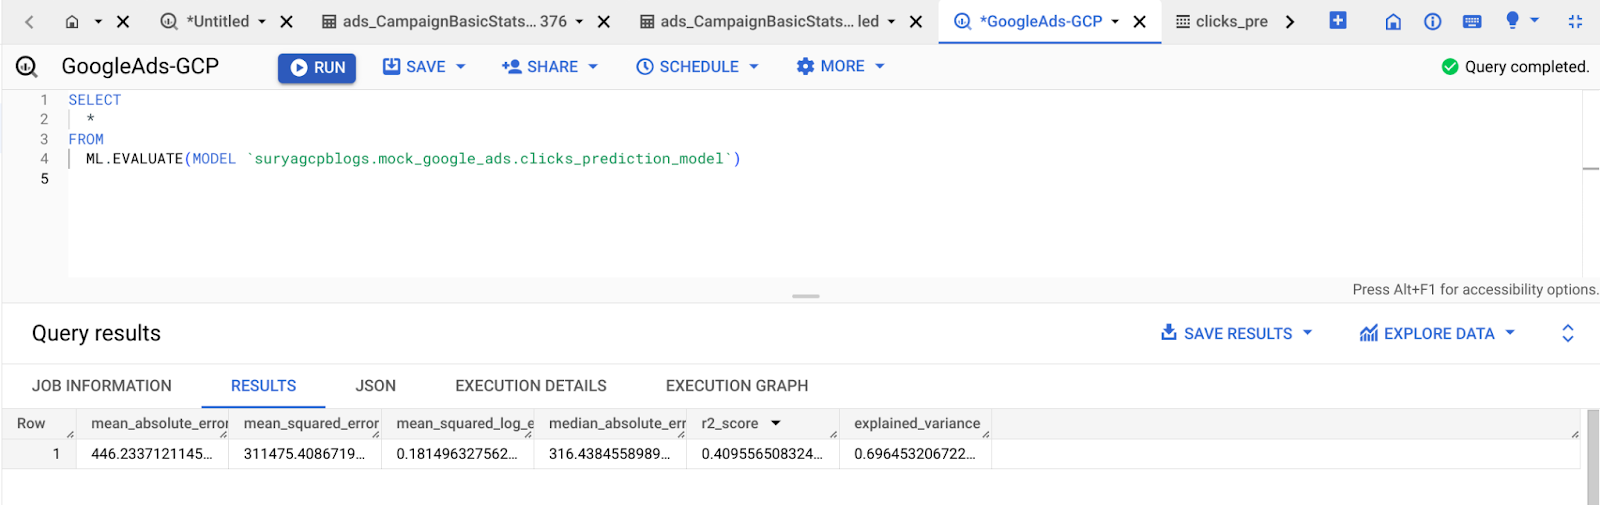
The R2 score of 0.41 indicates that about 41% of the variance in the target variable metrics_clicks can be explained by the model. The Mean Absolute Error (MAE) indicates that, on average, the model's predictions are about 446 clicks off from the actual values.
The next step would be to use this model to predict the number of clicks in the next 7 days.
We'll use historical averages for the segments_device, metrics_impressions, and metrics_interactions features.
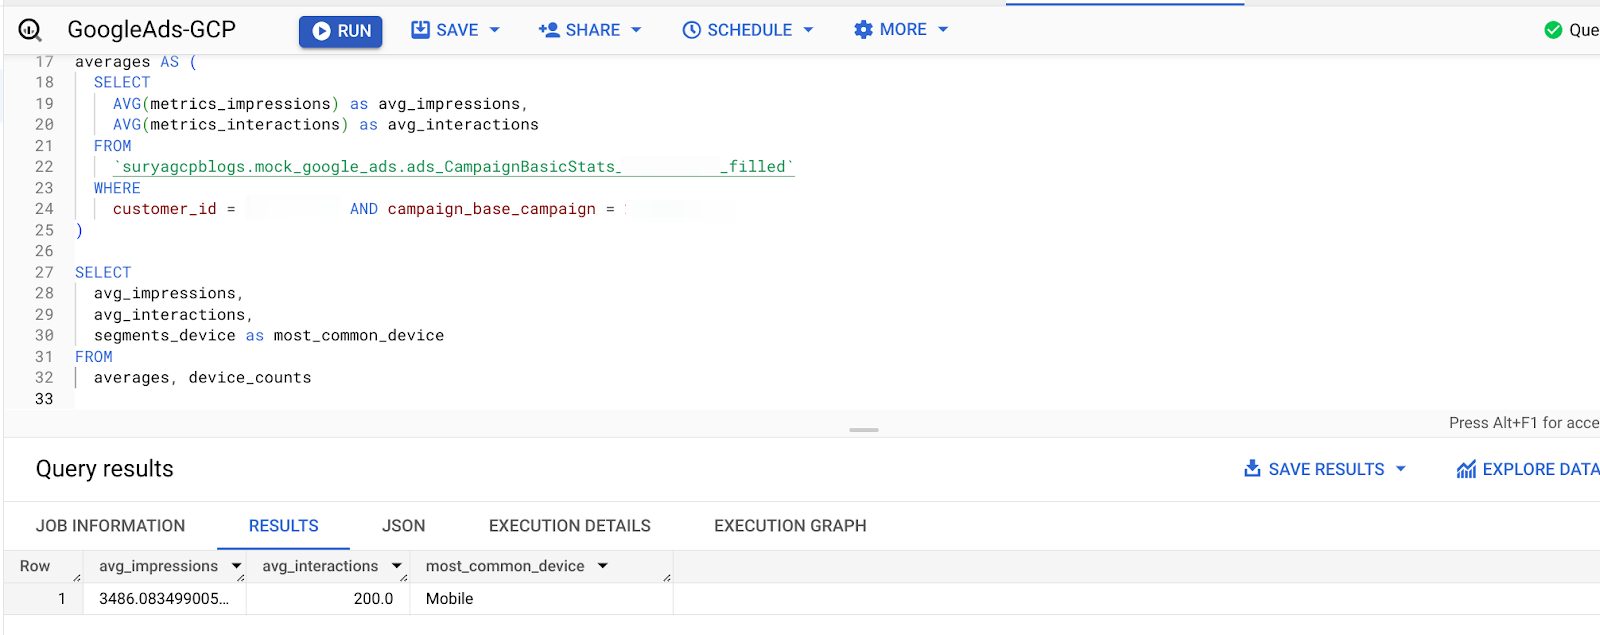
First, let's calculate the averages of metrics_impressions and metrics_interactions using historical data. We will also determine the most common segments_device value as it's a categorical feature.
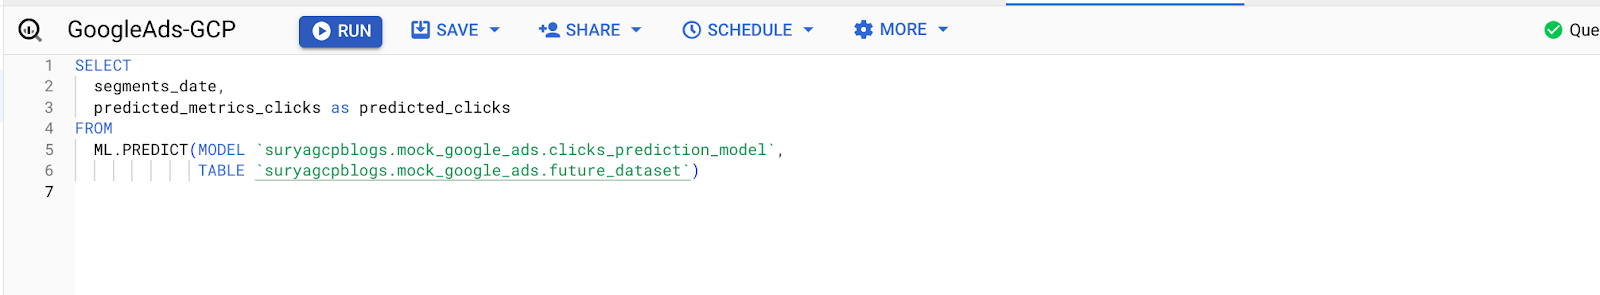
Now, lets run the prediction model and predict clicks for the next 7 days.
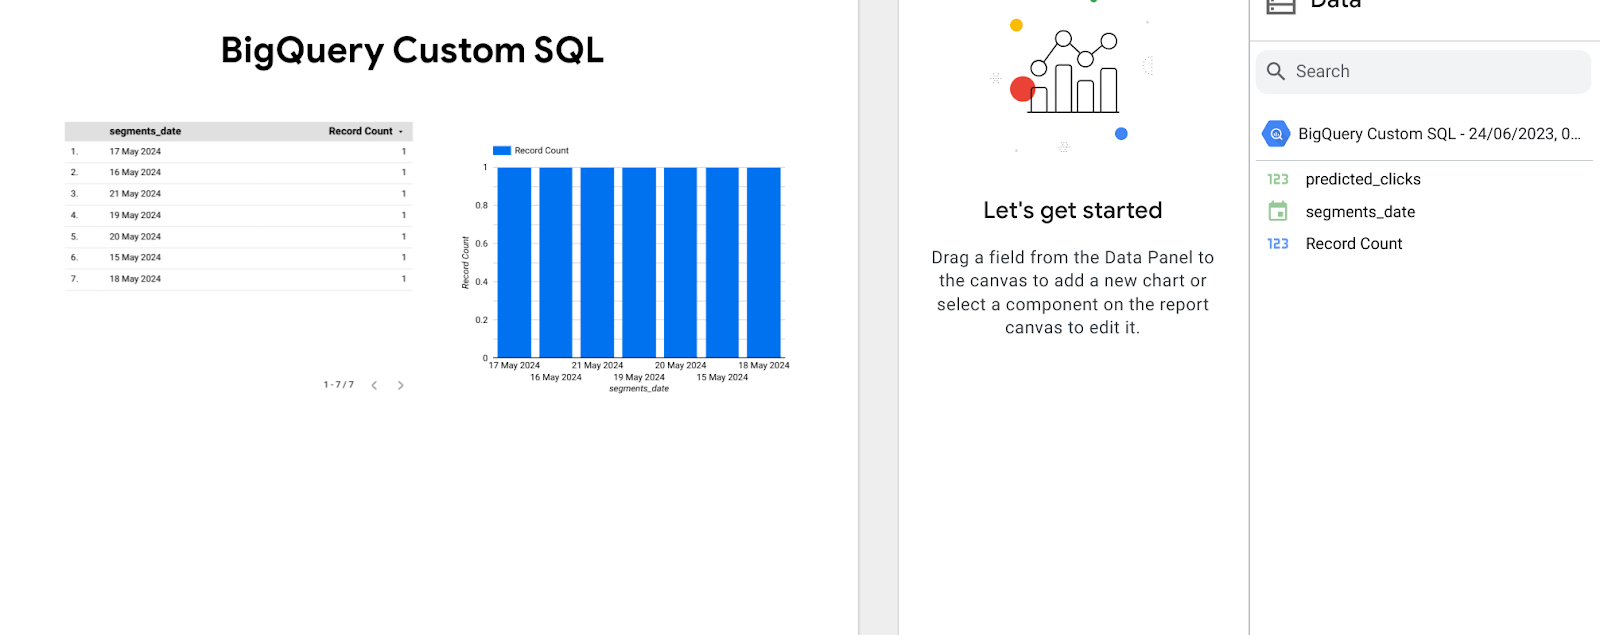
I have connected it to Looker and here is the output.
As this detailed journey unfolds, it's clear that marrying Google Ads data with BigQuery holds the power to drastically innovate your marketing approach. Through this guide, I aimed to bridge the gap between strategy and technical understanding, illuminating the compelling potential of BigQuery's machine learning capabilities to fine-tune your marketing endeavors.
While the model we explored is not without its imperfections and offers opportunities for refinement, it paves the way towards more strategic and data-driven campaign management.
As a practitioner, harnessing these insights can make a world of difference in garnering more visibility and superior business outcomes. I hope this guide serves as a crucial compass in your expedition for superior Google Ads optimization via BigQuery.

Disclaimer: This article reflects the personal views and opinions of the author and does not constitute, nor should it be construed as, the official position or policy of my Employer. My Employer has not reviewed, or endorsed the content of this article.